Quantative Momentum Made Simple
See which symbols have reached new highs — and exactly how much they’ve moved — across different timeframes.
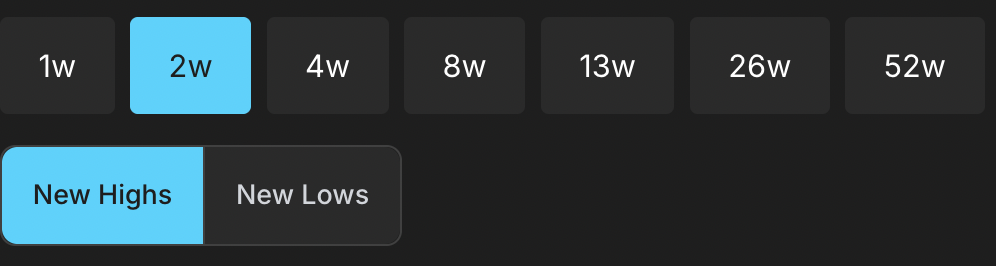
Track new highs across 7 timeframes (weekly to yearly) instead of just annual data. Get percentage context for each timeframe so you can evaluate momentum at every level.
Compare thousands of stocks in real-time instead of analyzing one at a time. See statistical outliers across the entire market with recent performance vs. historical patterns.
Core Analytics Platform
Four essential tools for systematic momentum analysis and market structure understanding.
Market Heatmaps
Real-time Performance Visualization
Comprehensive heatmaps showing stock performance across NSE indices. Visualize momentum patterns, identify outperformers, and track market trends across multiple timeframes. Interactive filtering and search capabilities allow for deep dive analysis of specific sectors or market cap ranges.
Z-Score Momentum Analysis
Find Momentum Early
Advanced Z-score analysis that identifies statistically significant momentum by normalizing recent performance against historical norms. This quantitative approach helps detect when stocks are exhibiting unusual strength or weakness relative to their typical behavior patterns.
New Highs & Lows Tracking
Breakout & Breakdown Identification
Track stocks hitting new highs and lows across multiple timeframes without waiting for traditional 52-week periods. Identify momentum breakouts early and spot potential trend reversals through systematic high/low analysis with customizable period definitions.
Market Health Monitor
Internal Market Structure Analysis
Monitor overall market condition through breadth indicators, advance/decline ratios, and internal market metrics. Get insights into market health that go beyond traditional index movements, helping you understand the true underlying strength or weakness of the market.
Start Your Analysis
Access professional-grade momentum analytics and market structure analysis tools.